Energy price cap January 2027: what could the rise cost your household?
Ofgem announces the January to March 2027 energy price cap by 25 November. Here are the main forecasts, what each could add to a typical bill, and how to work out the effect on your budget.
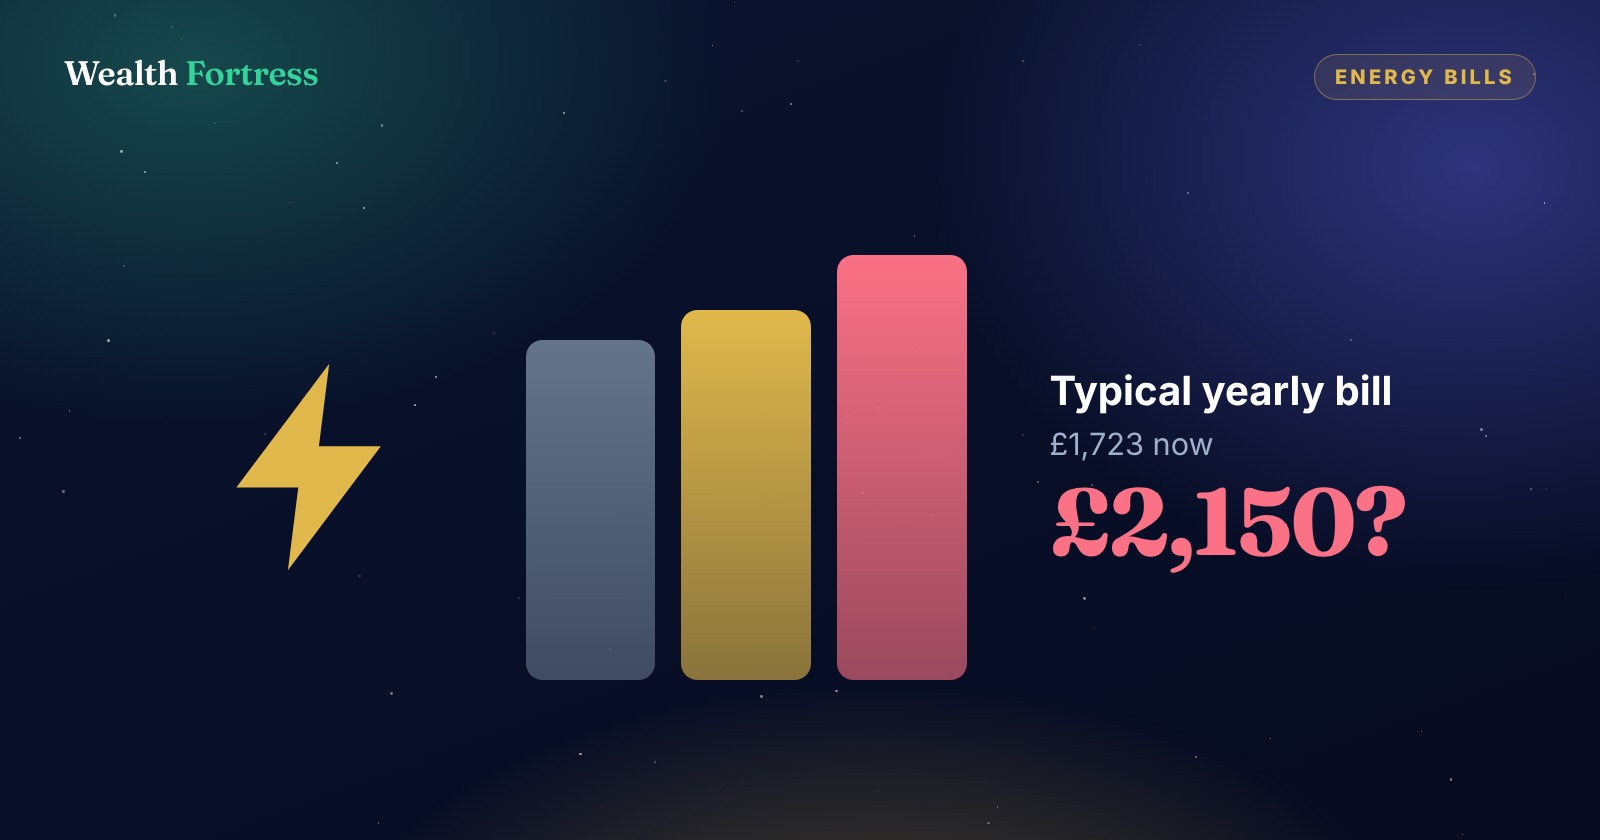
- The cap is £1,723 a year for a typical household now; Ofgem announces the next one by 25 November.
- Forecasts range from about £1,875 to £2,150, which is roughly £13 to £36 more a month.
- Work out what a rise does to what you have left each month, not just to the bill.
The energy price cap is the maximum a supplier can charge per unit of energy in England, Wales and Scotland, and it is reset every three months. Ofgem announces the cap for January to March 2027 on or before 25 November 2026, and forecasters expect a rise. Here is what the forecasts suggest.
Where the cap is now
For October to December 2026, the cap for a typical household paying by Direct Debit is £1,723 a year, which is about £144 a month. Your own bill will differ, because the cap limits the price per unit and the standing charge, not your total bill. How much you pay depends on how much energy you use, your region and your tariff.
What forecasters expect
Forecasts vary a lot, so it is better to think in ranges than to rely on one number. As of 4 November 2026, three reference points are the OBR central forecast of around £1,875 a year, a market-based estimate of around £2,150 a year, and an average of supplier predictions of roughly +27%.
On a typical £1,723 bill, the lower forecast adds about £152 a year, or £13 a month. The higher market-based estimate adds about £427 a year, or £36 a month. The +27% supplier forecast adds about £465 a year, or £39 a month. These are forecasts, not announcements, and the real figure could land outside this range.
How to work out the effect on you
The simplest approach is to take your own monthly gas and electricity bill, multiply it by the percentage rise in each scenario, and see the monthly difference. For example, on a £150 monthly bill, a 25% rise adds about £37 a month. Then compare that with what you have left after essentials each month, because that is the number that really shows how much a rise hurts.
Our free Energy Bill Calculator does this for you. Put in your bill, pick a scenario, and it shows the extra cost a month and a year. If you add your take-home pay and essentials, it also shows what the rise does to the money you have left. There is no signup.
Help that has been announced
The Budget on 28 October 2026 included a one-off £100 payment for households in council tax bands A to D in England, due from January 2027. We explain who gets it, and how to spot scams, in our post on the £100 energy payment. The Budget also extends 0% VAT on household electricity to 1 July 2027, and plans to remove gas standing charges by the end of 2027 or soon after, although heavy gas users could end up paying more.
Where does the extra cost come from?
If a rise is likely, decide now where the money will come from, rather than letting it quietly squeeze whatever you were saving. Our guide to budgeting when bills rise walks through a simple way to do that, and our free Golden Percentages tool builds a personal split of what is left each month.
See the rise on your own bill
Put in your monthly bill, pick a forecast, and see the extra cost a month and a year. No signup.
Open the Energy Bill Calculator